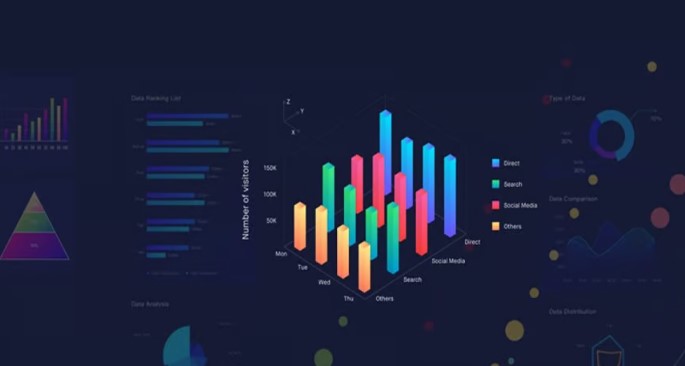
In today’s data-driven world, big data visualization has become an essential tool for businesses aiming to harness the power of vast datasets.
By transforming complex data into visually engaging formats, organizations can uncover valuable insights, make informed decisions, and drive innovation.
This article will explore the various techniques, benefits, and best practices of big data visualization.

What is Big Data Visualization?
Definition and Importance
Big data visualization refers to the process of representing large and complex datasets through visual elements such as charts, graphs, and maps.
This approach allows data analysts and decision-makers to understand trends, patterns, and correlations that might be missed in raw data.
The Role of Big Data Visualization in Business
In the business world, big data visualization plays a crucial role in simplifying data analysis and enhancing data-driven decision-making.
By providing clear and concise visual representations, companies can quickly identify key metrics, monitor performance, and predict future trends.
Techniques for Effective Big Data Visualization
Choosing the Right Visualization Tools
Selecting the appropriate visualization tools is vital for effective big data visualization. Popular tools include Tableau, Power BI, and D3.js.
Each tool offers unique features and capabilities, catering to different needs and expertise levels.
Data Preprocessing and Cleaning
Before visualizing data, it is essential to preprocess and clean the dataset. This step involves removing duplicates, handling missing values, and standardizing data formats to ensure accuracy and consistency.
Utilizing Various Visualization Types
Different types of visualizations serve different purposes. Some common types include:
- Bar Charts: Ideal for comparing categorical data.
- Line Charts: Useful for showing trends over time.
- Scatter Plots: Great for identifying correlations between variables.
- Heatmaps: Effective for visualizing density and intensity of data points.
Incorporating Interactivity
Interactive visualizations enhance user engagement and provide deeper insights. Features like hover-over details, clickable elements, and drill-down capabilities allow users to explore data from multiple perspectives.
Benefits of Big Data Visualization

Improved Decision Making
Big data visualization enables faster and more accurate decision-making by presenting data in a clear and understandable manner. Decision-makers can quickly grasp key insights and respond to emerging trends.
Enhanced Data Comprehension
Visualizations simplify complex data, making it easier for stakeholders at all levels to comprehend and interpret information. This improved understanding fosters collaboration and drives strategic initiatives.
Identification of Patterns and Trends
Visualization tools help identify patterns, trends, and anomalies within datasets that may not be apparent through traditional analysis methods. Recognizing these patterns can lead to innovative solutions and competitive advantages.
Real-Time Data Monitoring
Big data visualization allows for real-time monitoring of key metrics and performance indicators. This capability is particularly valuable in industries where timely decision-making is critical, such as finance, healthcare, and logistics.
Best Practices for Big Data Visualization
Define Clear Objectives
Before creating visualizations, it is essential to define clear objectives and understand the audience’s needs. This ensures that the visualizations effectively communicate the intended message.
Focus on Simplicity
Simplicity is key to effective big data visualization. Avoid cluttering visualizations with unnecessary details and focus on presenting the most relevant information. Use clear labels, concise titles, and intuitive color schemes.
Ensure Data Accuracy
Accurate data is the foundation of reliable visualizations. Regularly validate and update datasets to maintain accuracy. Inaccurate data can lead to misleading visualizations and incorrect conclusions.
Leverage Advanced Analytics
Incorporating advanced analytics techniques, such as machine learning and predictive modeling, can enhance the value of big data visualizations. These techniques provide deeper insights and enable more sophisticated analysis.
Common Challenges in Big Data Visualization
Data Quality Issues
Poor data quality can significantly impact the effectiveness of visualizations. Incomplete, inconsistent, or outdated data can lead to incorrect interpretations and flawed decisions.
Implementing robust data management practices is crucial to address these challenges.
Overwhelming Data Volume
The sheer volume of big data can be overwhelming, making it difficult to identify relevant information.
Employing data reduction techniques, such as sampling and aggregation, can help manage large datasets and focus on critical insights.
Ensuring User Accessibility
Creating visualizations that are accessible to a broad audience, including those with disabilities, is essential.
Utilize color-blind friendly palettes, provide alternative text descriptions, and ensure compatibility with screen readers to enhance accessibility.
Balancing Detail and Overview
Finding the right balance between detail and overview is challenging. Too much detail can overwhelm users, while too little can obscure important insights.
Providing multiple levels of detail, such as summary views and drill-down options, can help strike this balance.
Future Trends in Big Data Visualization
Integration with AI and Machine Learning
The integration of artificial intelligence (AI) and machine learning with bigdata visualization is a growing trend.
These technologies can automate data analysis, generate predictive insights, and create dynamic visualizations that adapt to changing data patterns.
Enhanced Real-Time Analytics
Real-time analytics capabilities are advancing, allowing organizations to visualize and respond to data in real time.
This trend is particularly relevant for industries requiring immediate insights, such as finance, healthcare, and retail.
Increased Use of Augmented Reality (AR) and Virtual Reality (VR)
Augmented reality (AR) and virtual reality (VR) are emerging as powerful tools for bigdata visualization.
These technologies offer immersive and interactive experiences, enabling users to explore data in three-dimensional environments.
Emphasis on Storytelling
Effective bigdata visualization increasingly incorporates storytelling elements. Narratives help contextualize data, making it more relatable and compelling. Combining data with storytelling enhances engagement and facilitates better decision-making.
Conclusion
Big data visualization is a powerful tool that enables businesses to unlock the full potential of their data.
By leveraging advanced visualization techniques, organizations can improve decision-making, enhance data comprehension, and identify valuable patterns and trends.
Despite the challenges, the future of big data visualization looks promising with the integration of AI, real-time analytics, and immersive technologies.
By following best practices and staying abreast of emerging trends, businesses can harness the power of big data visualization to drive innovation and maintain a competitive edge.